
Infographics That Make Complex Ideas Clear
Turn research, data, and expertise into visual stories your audience can understand and share.
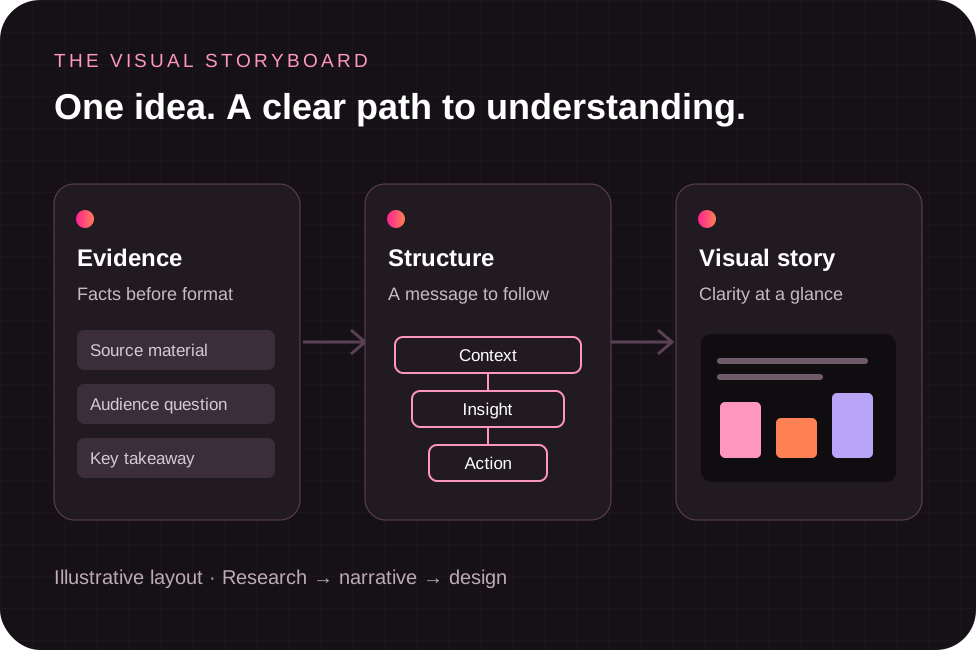
Start With the Story, Then Design the Visual
An effective infographic answers a clear question. We shape the message, organize the evidence, and design a visual that works for the people who will read it.
A Clear Audience
Define who the infographic is for and the question it should answer.
Evidence You Can Follow
Collect the source material and check the numbers before choosing a chart or visual format.
A Purpose for Every Element
Use hierarchy, color, and labels to make the main point easy to understand.
Choose a Format That Fits the Information
The information determines the format. A comparison needs a different structure from a process or a data story.
Data Stories
Make numerical comparisons clear with consistent scales, precise labels, and visible sources.
Processes and Timelines
Show how steps connect, what happens next, and where decisions change the path.
Comparisons and Explainers
Help readers compare options or understand a topic without making them work through dense prose.
From Research to a Finished Asset
Research and storyboarding come before visual styling. Review the message and source material, organize the narrative, then refine the design before preparing it for publication.
1. Brief and Research
Agree on the audience, key message, available evidence, and intended use.
2. Structure and Design
Build the story, choose the visual format, and establish a readable hierarchy.
3. Review and Publish
Check copy, data, sources, and readability at the sizes where the asset will appear.
Designed for Reading, Sharing, and Search
A visual should be understandable on the page where it is published, including smaller screens. Keep important labels readable and provide useful accompanying text.
Readable at the Intended Size
Check label sizes, contrast, spacing, and the order in which readers encounter information.
Context Around the Visual
Use clear page copy and descriptive alternative text so readers can understand what the infographic explains.
A Distribution Plan
Match publication and outreach to the audience and topic, then review engagement and earned links.
Bring Your Topic and Source Material
Book A MeetingTell us what you want to explain, who needs to understand it, and where the infographic will be used. Share existing research or data so we can discuss a suitable visual approach.
Frequently Asked Questions


GET A CONSULTATION
Fill out this form, and one of our account managers will reach out to you with insights on your site.