


- Home

- Blog
- Advanced SEO
- Data Visualization for SEO: Painting a Clear Picture
Data Visualization for SEO: Painting a Clear Picture
Enhancing SEO Strategies With Effective Data Visualization Techniques In an era where data reigns supreme, deploying effective data visualization techniques can significantly amplify the potency of a […]
Enhancing SEO Strategies With Effective Data Visualization Techniques
In an era where data reigns supreme, deploying effective data visualization techniques can significantly amplify the potency of a company’s SEO strategies.
By transforming complex datasets into comprehensible visual formats, businesses are empowered to discern patterns, monitor SEO campaign performance, and identify actionable insights with unprecedented clarity.
LinkGraph’s SEO services harness this transformative power, leveraging it to optimize and tailor strategies that propel clients to the pinnacle of search engine results.
Visual tools like Search Atlas not only simplify the interpretation of marketing reports and seo analytics but also facilitate insightful decision-making for sustainable growth.
Keep reading to discover how visual analytics can revolutionize your approach to SEO.
Key Takeaways
- Effective SEO Strategies Require a Combination of Meticulous Data Analysis and Visual Storytelling
- LinkGraph’s Search Atlas SEO Tool Provides Valuable Visualizations That Highlight Areas for Improvement and Guide Campaign Adjustments
- Color-Coded Data Visualizations Can Prioritize SEO Tasks and Streamline the Decision-Making Process for Businesses
- Competitive Analysis Tools and Visual Data Comparisons Are Crucial for Understanding Market Position and Informing SEO Tactics
- Technical SEO Audits, Visualized Through Charts and Diagrams, Are Essential for Improving Website Crawlability and User Experience
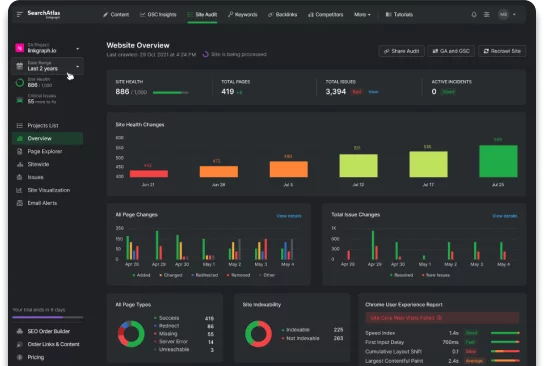
Unlocking SEO Potential With Data Visualization

In the rapidly evolving landscape of digital marketing, the synthesis of Search Engine Optimization practices with effective data visualization has emerged as a cornerstone for driving website traffic and improving online visibility.
A professional SEO strategy transcends mere keyword placement; it involves a deep dive into data analysis to pinpoint where optimization efforts should be channeled.
With tools such as LinkGraph’s Search Atlas at their disposal, marketing professionals and business owners can tailor visualizations that shine a light on their SEO strengths, map out intricate site structures for seamless indexing by search engines, and implement color-coded systems to sharply focus on priority SEO tasks.
Far from mere aesthetic enhancements, these robust data visualization techniques empower users with actionable insights, allowing them to refine their SEO campaign with precision and clarity.
Identifying Key Data for SEO Improvement
At the heart of any successful SEO campaign lies a foundation built on meticulously sourced data. Mastery over this crucial element enables business owners and SEO professionals to unlock a website’s full potential, pinpointing key performance indicators such as organic search ranking improvements, visitor conversion rates, and session durations that shape the trajectory of an SEO strategy.
LinkGraph’s SEO services envelop business partners in an ecosystem where SEO data becomes a guiding light, not a hurdle. LinkGraph leverages tools like Search Atlas SEO to filter through the noise, distinguishing actionable keyword opportunities, backlink profiles, and page-level metrics that can be the catalysts for improved search engine positioning and bolstered digital footprints.
Customizing Visualizations to Highlight SEO Strengths
Customization of visualizations serves as an integral part of harnessing SEO data effectively, a practice LinkGraph has finely honed. By deploying a range of visualization types from treemaps for hierarchical data representation to line charts that depict trends over time, businesses can underscore the areas in need of attention. Such bespoke visual aids are not just illustrative, but also commence a clear pathway for the implementation of precise SEO interventions.
It is within the realm of expertly crafted graphical elements where the power of Search Atlas SEO tool truly comes to the fore. Pie charts and bubble graphs, for instance, are utilized to not only represent complex data sets but also to accentuate the disparities in keyword rankings or the density of backlinks. These visual distinctions crafted by LinkGraph enable a swift, informed response, pivoting the course of SEO campaigns toward success.
Visualizing Site Structure for Optimal Indexing
Efficient site navigation and comprehensible architecture are the backbone of indexing by search engines. LinkGraph, acknowledging this, assists clients in creating visualizations that delineate the intricacies of site structure, bolstering a website’s indexability and navigability for both users and search engine crawlers.
The adept utilization of Search Atlas SEO tool by LinkGraph in crafting sitemaps and architectural blueprints unlocks profound insights into the flow of a website’s pages. This visualization aids in identifying and addressing potential crawl barriers ensuring seamless consumption of content by search engines:
| SEO Element | Current Status | Recommended Action |
|---|---|---|
| Page Load Speed | Average | Optimize Images and Minify Code |
| 404 Error Pages | Multiple Detected | Implement Redirects or Renew Content |
| Site Depth | Excessive | Refine Navigation and Flatten Architecture |
Utilizing Color Coding to Prioritize SEO Tasks
In today’s complex digital arena, the strategic application of color coding in SEO data visualization plays an instrumental role in prioritizing tasks and streamlining workflow. LinkGraph employs this technique within its Search Atlas SEO tool, distilling a vast array of SEO metrics into an efficient format that highlights urgent issues with shades and hues, guiding SEO professionals and business owners alike toward areas that demand immediate attention.
The adoption of color can transform a daunting table of statistics into a clear and organized roadmap for SEO implementation:
| SEO Metric | Status | Priority Level (Color Code) |
|---|---|---|
| Backlink Authority | Weak | High (Red) |
| Mobile Responsiveness | Good | Medium (Yellow) |
| Keyword Spread | Optimal | Low (Green) |
LinkGraph’s innovative approach to SEO is epitomized by its utilization of intuitive color-coded schemes which aid in the formulation and adjustment of SEO strategies. Such visual cues cut through the opacity of raw data, offering a lucid and dynamic viewpoint that continuously informs the prioritization and execution of SEO tasks, ensuring that efforts are concentrated where they will have the most substantial impact on search engine rankings.
Tailoring SEO Dashboards for Maximum Insight

Optimization of Search Engine Optimization (SEO) outcomes hinges not only on the stratagems deployed but also on the adept monitoring of their effects.
A well-constructed SEO dashboard stands as an imperative asset for professionals and companies eager to distill critical website performance data into actionable insights.
Such bespoke dashboards are equipped to articulate selected metrics that reflect business goals, paint a clear picture of SERP positioning, delineate backlink profiles with penetrating visual representations, and spotlight website load times—a key factor in both user experience and search engine ranking algorithms.
LinkGraph excels in this arena by structuring tailored SEO dashboards that render intricate data sets into intelligible, and impactful compasses for strategic decision-making.
Selecting the Right Metrics for Your Dashboard
Embarking on the development of an SEO dashboard necessitates a clear-sighted approach to metric selection, ensuring each data point precisely aligns with defined SEO goals and business objectives. A keen focus on choosing metrics that directly influence organic search performance, such as Click-Through Rates (CTR), keyword rankings, and inbound link quality, facilitates a streamlined path to data-driven optimizations within an SEO strategy.
Within the armory of LinkGraph’s Search Atlas SEO tool, crafting a customized SEO dashboard becomes an exercise in strategic selection, with professionals targeting those metrics that serve as key indicators of success. This focus allows businesses to concentrate on data such as conversion rates and session length, which are essential for understanding user behavior and enhancing the overall effectiveness of SEO efforts.
Integrating SERP Positioning Into Dashboards
Astute incorporation of Search Engine Results Page (SERP) positioning into SEO dashboards empowers LinkGraph’s clients to grasp the impact of their strategies on search engine rankings. Such integration facilitates a continuous assessment of keyword performance, enabling real-time pivots in SEO approaches that keep pace with the dynamic nature of search algorithms.
LinkGraph harnesses the capabilities of Search Atlas SEO software to embed rank tracking functionality within client SEO dashboards. This integration allows for a thorough observation of ranking shifts across various search terms, providing a tangible gauge of SEO efficacy and guiding further refinement of the overarching digital marketing campaign.
Tracking Backlink Quality With Visual Graphs
LinkGraph’s dedication to refining SEO methodologies is exemplified in the innovative use of visual graphs to track backlink quality. This approach in the Search Atlas SEO software facilitates instantaneous recognition of the strength and relevance of each backlink, shedding light on the support they offer to a website’s authority.
The visual representation of backlinks as graphs not only simplifies the complexity of link analysis but also aids in the quick identification of patterns and anomalies. LinkGraph’s advanced SEO tools enable SEO professionals to effortlessly assess the health of their backlink profile, ensuring the capability to make informed decisions, and enhancing the efficacy of SEO strategies.
Monitoring Load Times to Aid SEO
In the pursuit of a strong SEO strategy, monitoring load times is of paramount importance as it significantly influences user experience and search engine rankings. LinkGraph’s Search Atlas SEO tool equips professionals with meticulous monitoring capabilities to ensure that a site’s loading speed is optimized for both efficiency and performance.
Swift site response not only retains visitor engagement but also sends positive signals to search engines, directly impacting a website’s visibility. Efficient load times are not a stationary target, but one that requires ongoing attention and adjustment:
- Regularly assessing page speed performance indicators
- Implementing speed-enhancing protocols
- Adjusting to new web standards and user expectations
Enhancing Keyword Research With Visual Analytics

In the realm of professional Search Engine Optimization, successful strategists grasp the transformative power of visual analytics in sprucing up their keyword research.
The art of identifying lucrative keyword opportunities, mapping their relationship with powerful content, and weighing search volume against competition demands not just keen insight, but also visual storytelling that can convey complex data with simplicity and impact.
By implementing innovative data visualization techniques such as keyword trend graphs, content relationship mappings, and bubble charts, experts at LinkGraph facilitate a deeper understanding of the dynamic SEO landscape, empowering clients to make informed decisions that escort their websites toward the pinnacle of search results.
Creating Keyword Trend Graphs for Spotting Opportunities
In the competitive terrain of SEO, LinkGraph distinguishes itself by its adept use of keyword trend graphs. These powerful visual aids enable professionals to detect emerging trends and untapped market segments, charting out pathways for strategic content alignment and targeting.
Through the application of the Search Atlas SEO tool, practitioners can harness real-time data, revealing fluctuations in keyword popularity and searcher behavior. This insight allows users to capitalize on keyword opportunities rapidly, strategically adjusting SEO efforts to maintain a competitive edge in the digital landscape.
Mapping Keyword to Content Relationship
LinkGraph optimizes the resonance of content with its intended audience by meticulously mapping keywords to the most relevant material through the Search Atlas SEO tool. This approach elevates the potential of each page, ensuring that content not only reaches the target audience but also engages them, enhancing the likelihood of conversion and bolstering the website’s authority.
Utilizing sophisticated algorithms and real-time SEO analysis, LinkGraph identifies correlations between search terms and website pages, revealing critical insights for content optimization. This method empowers businesses to align their content strategy with user intent, driving traffic to the website and fostering a higher rank in search results.
Using Bubble Charts for Search Volume vs. Competition
LinkGraph’s robust utilization of bubble charts provides a stark visual contrast between search volume and competition for various keywords. This visualization type allows SEO professionals to swiftly discern which terms might offer the highest potential return on investment and prioritize their targeting accordingly.
When strategists equip themselves with this visual advantage, it becomes demonstrably easier to strategize content around high-impact keywords that could elevate a site’s visibility in search results:
- Identify high volume, low competition keywords
- Understand the competitive landscape for niche-specific terms
- Adjust content and SEO strategies to focus on the most promising search queries
The application of bubble charts in LinkGraph’s SEO analytics tools facilitates an at-a-glance understanding of keyword viability amidst the competitive arena of organic search. Clients can gain invaluable insights, allowing them to leverage gaps in the market and craft content that resonates with both users and search engines.
Visualizing Backlink Profiles for Better Strategy

In the intricacies of Search Engine Optimization, backlinks wield immense authority, influencing how a website is perceived and prioritized by search engines.
Effective SEO campaigns necessitate not only the acquisition of backlinks but also a sophisticated analysis of their profiles.
By employing advanced data visualization techniques to chart backlink growth over time, analyze the origin of backlinks with network diagrams, and assess link value with scatter plots, LinkGraph equips SEO strategists with the tools to optimize their backlink strategies methodically.
This meticulous approach ensures a comprehensive grasp on the integral factors that shape a site’s reputation and rankings within the digital panorama.
Charting Backlink Growth Over Time
LinkGraph’s premium SEO service includes a comprehensive evaluation of backlink evolution, utilizing dynamic visualizations that track the growth of backlinks over specified time frames. These visual representations provide SEO professionals with a clear trajectory of link-building efforts, readily showcasing progress and identifying trends that inform future outreach strategies.
By graphically depicting the accumulation or attrition of backlinks, clients gain critical perspective on the effectiveness of their SEO work. LinkGraph’s strategic application of visualization arms them with the knowledge needed to hone in on successful techniques, ensuring that the quality and quantity of inbound links align with overarching SEO objectives.
Analyzing Backlink Sources With Network Diagrams
LinkGraph’s innovative SEO services utilize network diagrams as a potent visualization tool for dissecting the origin and quality of backlinks. These diagrams provide a clear and comprehensive view of the linking landscape, revealing how different websites and pages interconnect to form a web of referrals that bolster search engine trust and site authority.
By examining these network diagrams, LinkGraph’s clients can discern strategic patterns, assess the value of each backlink, and identify influential domains that can amplify their website’s credibility. This analytical approach enhances the precision of SEO strategies, enabling clients to focus on cultivating backlinks that impart the greatest impact on their search rankings.
Assessing Link Value With Scatter Plots
In the intricate domain of search engine optimization, scatter plots emerge as a powerful mechanism for evaluating the relative value of backlinks. This type of visualization allows SEO professionals at LinkGraph to quickly gauge the distribution of links based on predefined metrics such as domain authority and the volume of inbound links to ascertain their contribution to SEO success.
Representing complex backlink attributes through scatter plots simplifies the interpretative process for clients, providing a snapshot of the backlink landscape and facilitating strategic decision-making. This visualization aids businesses in distinguishing between high-value backlinks that can potentially improve search engine rankings and less impactful ones that require reevaluation:
- Spot high-authority domains that offer valuable backlinks
- Identify patterns in backlink profiles that correlate with SEO performance
- Pinpoint opportunities to enhance link-building efforts for maximum SEO gain
Leveraging User Behavior Data for SEO Gains

In the quest for a robust SEO campaign, comprehending user behavior stands as a pillar for formulating a targeted and effective strategy.
Professionals adept at SEO harness the richness of behavioral data, utilizing it to optimize every facet of the digital experience.
Heatmaps unveil patterns of user interaction, funnel visualizations clarify the customer journey towards conversion, and analysis of bounce rates offers insights for content refinement.
By interpreting these diverse data streams with sophisticated visualization tools, LinkGraph’s SEO services can enhance the user experience, optimize conversion funnels, and tailor content to meet the needs and behaviors of visitors, thereby propelling SEO performance to new heights.
Heatmaps to Understand User Engagement
In the arsenal of SEO analytics tools, heatmaps provide invaluable intelligence on user engagement across a website’s pages. LinkGraph strategically leverages this data visualization tool to illuminate areas that capture maximum visitor attention, revealing robust insights for optimizing website layout and content positioning.
Through the sophisticated implementation of heatmaps, LinkGraph empowers its clientele to interpret user activity effectively, translating patterns of engagement into tactical enhancements in SEO strategy. This approach ensures that both visual appeal and functional design converge to foster a user-friendly environment conducive to higher search rankings and improved user experiences.
Funnel Visualizations for Conversion Optimization
LinkGraph harnesses the potency of funnel visualizations to intricately map out the customer journey from initial engagement to conversion. This sharpens the focus of SEO strategies by spotlighting where drop-offs occur, enabling swift intervention and optimization of the conversion path.
The strategic use of funnel diagrams allows LinkGraph to distill complex behavioral data into clear, actionable insights. They deftly identify bottlenecks and optimize pivotal touchpoints, dramatically enhancing the likelihood of converting visitors into customers and driving business success through informed SEO tactics.
Visualizing Bounce Rates to Improve Content
LinkGraph utilizes bounce rate visualization as a profound indicator of content efficacy and user satisfaction. Transforming raw bounce rate data into intuitive charts and graphs, the platform aids SEO experts in pinpointing pages that fail to engage, prompting a refined content strategy that advances user retention and sustains organic ranking growth.
By culling insights from bounce rate analytics, LinkGraph enables businesses to reconstruct their content approach in alignment with user needs. It uncovers underlying issues affecting user experience, such as suboptimal content relevance or poor navigational structure, charting a course for content enhancements that fortify SEO initiatives.
Data Visualization for Technical SEO Audits
In the quest for digital prominence, technical SEO audits emerge as the blueprint for search engine success, with data visualization playing a pivotal role in translating technical insights into strategic actions.
The essence of this process involves a granular examination of a website’s structure and the seamless functionality that serves both the algorithmic eyes of search engines and the discerning needs of users.
Through the adept creation of flowcharts, SEO professionals at LinkGraph can vividly illustrate website crawlability, ensuring that the digital paths lead search engines through a rich tapestry of content.
Diagramming site architecture contributes to an understanding of the user experience (UX), highlighting areas for enhancement and smoother navigation.
Additionally, by presenting mobile responsiveness stats graphically, LinkGraph reveals performance metrics that are crucial in today’s mobile-first world, fostering optimizations that resonate with both users and search engines.
Flowcharts for Website Crawlability
LinkGraph’s skillful application of flowcharts elevates technical SEO audits, affording professionals a bird’s-eye view of a site’s crawlability. These visual representations chart a course for search engine bots, highlighting the pathways that lead to a well-indexed site.
Utilizing flowcharts, LinkGraph demystifies the web of connections between pages, ensuring that the site hierarchy is logically structured and accessible. This clarity is essential in identifying and remedying any navigation barriers that might impede search engines from thoroughly exploring a website:
| SEO Audit Element | Discovery | Impact on Crawlability | Recommended Action |
|---|---|---|---|
| Duplicate Content | Found across multiple URLs | Reduces efficiency of crawls | Implement canonical tags |
| Broken Internal Links | Several discovered | Hinders navigation for bots | Fix or redirect the broken links |
| Deep Site Architecture | Content buried under several layers | Challenges timely indexing of deep pages | Simplify site structure for ease of access |
Diagramming Site Architecture for Improved UX
LinkGraph excels in distilling the complexities of site architecture into digestible diagrams that not only enhance the user journey but also serve as a critical component for improved user experience (UX). By structuring data into comprehensive site diagrams, the company ensures that both users and search engine crawlers can navigate a website’s pages with ease, translating to a boost in search optimization and user satisfaction.
The meticulous formulation of architectural diagrams by LinkGraph enables SEO professionals to spot friction points that disrupt user interaction, thereby tailoring a more intuitive site layout. This proactive approach to UX design proactively anticipates user needs, facilitating an online experience that aligns with the rapid browsing habits of modern web visitors and underscores the importance of accessibility in a strategic SEO framework.
Presenting Mobile Responsiveness Stats Graphically
Graphical representations of mobile responsiveness statistics are employed by LinkGraph to offer clients a clear, visual understanding of their site’s performance on mobile devices. These visuals are key, given the increasing significance of mobile optimization for SEO in light of Google’s mobile-first indexing approach.
Illustrated through engaging charts, these statistics lay bare the responsiveness of different website elements, encompassing site speed, navigation structure, and readability on smaller screens. This form of data visualization acts as a diagnostic tool, pinpointing areas for enhancement and ensuring mobile users receive an optimal browsing experience:
| Mobile Metric | Performance Indicator | SEO Impact | Recommendation |
|---|---|---|---|
| Responsive Design | Adaptable on Various Screen Sizes | Facilitates User Experience | Implement Fluid Grid Layouts |
| Touchscreen Readiness | Inadequate Button Size | Impedes Navigation | Enlarge Touch Elements |
| Mobile Load Speed | Slower Than Desktop | Diminishes User Retention | Optimize Images and Enable Compression |
In this data-driven era, LinkGraph capitalizes on the effectiveness of visual aids to communicate pivotal SEO information, promoting swift, informed decisions that elevate a site’s performance across mobile platforms.
Competitor SEO Analysis Through Visualization

In the intricate chess game of Search Engine Optimization, understanding the landscape of competition is not just advisable; it is vital for any entity looking to carve out its place atop search rankings.
The strategic deployment of competitive analysis tools has become instrumental in crafting superior SEO strategies.
Through the application of competitive graphs, visual overlays, and visual comparative data, businesses can mine the SEO successes of their adversaries to inform their tactics.
These visual analytics provide a crystal-clear understanding of one’s position in the SEO arena, shedding light on competitors’ strengths, and uncovering market trends critical for creating an indomitable online presence.
Benchmarking SEO Performance Using Competitive Graphs
The strategic utilization of competitive graphs plays a pivotal role for SEO professionals seeking to benchmark their website’s performance against competitors. LinkGraph, through its sophisticated suite of SEO tools, enables the delineation of key metrics across competitors, providing clients with a visual comparison crucial for gauging their position in the market landscape.
LinkGraph’s comprehensive visual analytics can illuminate areas of strength and potential improvement, offering clarity on competitive positioning. Armed with this knowledge, businesses are empowered to refine their SEO strategies, identify gaps in their current approach, and seize opportunities to outperform their market rivals.
Identifying Competitors’ Strengths With Visual Overlays
LinkGraph’s analytical prowess extends to scrutinizing competitor landscapes through the strategic use of visual overlays. These overlays provide a multidimensional view of the competitive space, allowing users to quickly discern areas where competitors are excelling and opportunities for advancement in their own SEO approaches.
Employing visual overlays in competitor analysis fortifies LinkGraph’s clients with a nuanced perspective on market dynamics. It is this clarity that unfurls a roadmap for businesses to fortify their search engine optimization efforts, tailoring campaigns that not only match but surpass the digital footprint carved out by their competitors.
Spotting Market Trends With Comparative Visual Data
LinkGraph goes beyond conventional SEO metrics, delving into the visual elucidation of market trends with comparative visual data analysis. These insightful visualizations bring to light evolutionary market trajectories, enabling clients to nimbly adapt their SEO strategies and align with the most current and impactful industry trends.
By harnessing comparative visual data, LinkGraph offers clients a high-altitude view of market movements, highlighting shifting patterns that could signal burgeoning opportunities or emerging threats. This wealth of visualized data crystallizes complex market dynamics, placing invaluable strategic guidance at SEO professionals’ fingertips.
Conclusion
Effective data visualization techniques significantly enhance SEO strategies by providing clear, actionable insights that guide decision-making and strategy refinement.
Bringing complex data sets to life, these techniques allow for improved understanding of SEO elements such as backlink profiles, site structure, and keyword opportunities.
Tools like LinkGraph’s Search Atlas illuminate strengths and weaknesses in SEO practices, enabling users to prioritize tasks with color-coding, tailor dashboards to monitor important metrics, and visualize both user behavior and competitor analyses for strategic advantage.
By turning quantitative data into visual stories, SEO professionals can identify trends, optimize website performance, and stay ahead in the competitive digital landscape, ensuring that efforts are focused where they will have the most impact on search engine rankings.