


- Home

- Blog
- Advanced SEO
- Google Analytics Dashboards
Google Analytics Dashboards
Maximizing Insights: Mastering Your Google Analytics Dashboard Within the vast field of digital marketing, the ability to harness website data effectively stands paramount, and Google Analytics serves […]
Maximizing Insights: Mastering Your Google Analytics Dashboard
Within the vast field of digital marketing, the ability to harness website data effectively stands paramount, and Google Analytics serves as the navigator through the digital realm.
It’s a tool that equips businesses with the insights necessary to refine their online strategy, translating raw data into actionable knowledge.
By mastering the Google Analytics dashboard, companies can monitor conversion rates, analyze audience behavior, and adjust marketing campaigns with precision.
LinkGraph’s SEO services ensure that these capabilities are not just accessible but also intuitively actionable for businesses.
Keep reading to discover how a well-customized dashboard can transform data analytics into a strategic asset for any marketing team.
Key Takeaways
- Mastery of Google Analytics Dashboards Allows Businesses to Draw Actionable Insights From Varied Data Sets
- Customizing Analytics Dashboards to Track Specific Metrics Enables Firms to Focus on Strategies With the Highest ROI
- Segmenting Audience Data in Google Analytics Helps Organizations Optimize User Experience and Content Relevancy
- Real-Time Reporting in Google Analytics Provides Immediate Data for Agile Adjustments to Marketing Strategies
- Utilizing Custom Reports and Dashboards Enhances Collaborative Decision-Making and Strategic Efficiency in Organizations
Understanding Your Google Analytics Dashboard Layout

Mastering the intricacies of a Google Analytics Dashboard is essential for individuals eager to glean comprehensive insights into their website’s performance.
This entails not just a cursory glance at the wealth of data available but a precise understanding of the dashboard’s core compartments.
By learning how to adeptly navigate through various elements and tailoring the dashboard to align with specific requirements, users harness the power to draw actionable insights.
LinkGraph’s SEO services, underpinned by the Search Atlas SEO Tool, exemplify proficiency in leveraging such analytics to optimize digital marketing strategies.
As professionals plunge into these analytics, configuring their digital marketing dashboards becomes less daunting, and the ability to analyze web traffic, session duration, and conversion rates becomes second nature.
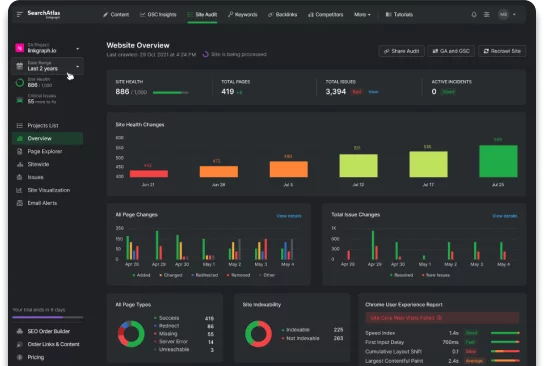
Identify the Main Components of the Dashboard
The foundation of any effective Google Analytics dashboard lies in its ability to present key metrics in a coherent, easily navigable format. This includes a conglomeration of widgets, pie charts, bar charts, and geomaps, each serving a distinct purpose in visualizing various data sets.
At the helm of dashboard essentials, users encounter a layout that is intuitively partitioned into sections such as real-time data, audience demographics, acquisition channels, and Behavior Metrics:
- Real-time data offers a snapshot of current activity on a website, allowing businesses to monitor active visitors and ongoing campaigns with immediacy.
- Audience demographics provide valuable insights into the composition of a site’s visitors, inclusive of age, gender, device usage, and geographic distribution.
- Acquisition channels breakdown the various traffic sources, from organic search engine optimization efforts to paid campaigns, empowering companies to track the efficacy of their marketing strategies.
- Behavior metrics shed light on user engagement, with focus points such as pageviews, session duration, bounce rate, and the performance of specific landing pages.
Learn How to Navigate Different Dashboard Elements
Understanding the Google Analytics dashboard is akin to becoming fluent in a new language; it enables users to interpret the nuanced story their data tells. Each element, from the acquisition overview to user behavior, functions as a lexicon that, when mastered, can unveil profound insights into customer journey and campaign performance.
- Acquisition overview charts illustrate the paths visitors take to arrive at the website, highlighting the strength of SEO efforts and PPC campaigns.
- Behavior reports dissect the intricacies of user interaction, offering clarity on content effectiveness and potential for optimization.
- Conversions sections track goal completions, mapping out the pivotal touchpoints that lead to customer conversion.
Effortlessly navigating through these elements requires an understanding of each component’s role: identifying the right chart type for data representation, applying dashboard filters to hone in on specific metrics, or customizing widgets to create a dashboard that serves as a tailored digital marketing dashboard. LinkGraph’s experts exemplify this finesse with Search Atlas SEO tool, guiding clients to not just read, but interpret analytics in ways that amplify search engine optimization success.
Customize the Dashboard View to Your Needs
LinkGraph’s SEO services underscore the importance of a custom-fit Google Analytics dashboard, stressing that the default schematic may not align with every client’s unique objectives. The dynamic nature of the Search Atlas SEO tool allows users to alter dashboard views, ensuring each marketer can direct their focus to the analytics that matter most, whether it’s drilling into social media engagement or monitoring site-wide goal conversions.
Individualization extends to the Search Atlas SEO tool, which professionals may use to craft a bespoke analytics experience. This includes selecting relevant widgets and pie charts, configuring dashboard filters, and creating dashlets that encapsulate specific marketing data points – from website traffic nuances to PPC performance – all in service of underpinning data-driven decision making.
Setting Up Goals and Tracking Conversions
Establishing well-defined business objectives within Google Analytics sets the stage for a deep dive into the customer journey, enabling organizations to align their digital strategy with tangible outcomes.
By setting specific goals, companies can methodically track user conversions, revealing a wealth of data on customer behavior and the efficacy of their marketing efforts.
Grasping the nuances of conversion data is central to gauging the trajectory of success and refining tactics for optimal performance.
With LinkGraph’s SEO services and the Search Atlas SEO tool, the process of interpreting these critical metrics is simplified, empowering businesses to further optimize their campaigns and drive meaningful engagement.
Define Your Business Objectives in Google Analytics
Defining business objectives within Google Analytics is a pivotal step toward tuning into the frequency of success. It requires corporations to crystallize their ambitions into measurable targets, such as increased customer retention or heightened brand awareness, making them observable within the spectrum of website analytics.
With Google Analytics, executives can translate these benchmarks into trackable goals, laying a path that captures the intricate dance between visitor interactions and desired outcomes. LinkGraph’s SEO services guide this translation process, ensuring that each click and visit is not merely a number, but a step towards achieving the company’s strategic vision.
Set Up Goals to Track User Conversions
LinkGraph’s SEO services emphasize the critical role that goal-setting plays in capturing the full scope of user conversions. By meticulously programming Google Analytics with tailored goals, organizations gain the capability to track conversions with precision, thereby unraveling the layers of user behavior that culminate in those pivotal conversion points.
The strategic implementation of goals in Google Analytics, facilitated by LinkGraph’s expertise, provides an invaluable touchstone for measuring the effectiveness of search engine optimization strategies. Businesses are able to distill their digital endeavors into clear, quantifiable outcomes that reflect the resonance of their content with the target audience, facilitating optimization and maximizing ROI.
Interpret Conversion Data to Measure Success
Cracking the code of conversion data is akin to assembling a puzzle that, when completed, presents a clear image of an organization’s triumphant moments. Scrutinizing the kaleidoscope of metrics such as source, medium, and campaign illuminates the pathways leading to goal completions and pinpoints the strategies that resonate most deeply with the target audience.
Businesses that interpret conversion data with acumen are rewarded with the capacity to fine-tune their marketing endeavors. LinkGraph’s SEO services, backed by Search Atlas SEO tool’s robust capabilities, enable companies to extract and actionize these data-driven insights, thereby sculpting an agile, winning digital strategy that is responsive to the ever-evolving customer journey.
Analyzing Audience Behavior With Dashboard Data

In a landscape where data rules supreme, analyzing audience behavior through Google Analytics dashboard data stands as a cornerstone of effective digital strategy.
Dissecting the layers of website visitor insights with precision allows businesses to tailor experiences, ensuring content resonates with the intended audience.
From the meticulous segmentation of users for personalized analysis to the comprehensive evaluation of content performance, the tools at one’s disposal within Google Analytics are potent.
Proficient use of these resources, such as the Behavior Flow Report, unpacks the web of user paths, affirming the pivotal connection between data scrutiny and the enhancement of user engagement.
Segment Your Audience for Tailored Insights
Segmentation within a Google Analytics dashboard empowers organizations to slice through the aggregate noise and focus on specific user groups. This refined lens reveals patterns and preferences among differing segments of a business’s audience, enabling targeted strategic adjustments.
Cultivating a deeper comprehension of distinct audience segments helps businesses meet the unique needs of their clientele:
- By assessing the device preferences of various demographic groups, firms adapt their web designs to enhance user experience accordingly.
- Understanding geographical nuances allows for localization of content, making marketing efforts more relevant and impactful.
- Examining session behaviors by visitor type provides clarity on what drives engagement and what might deter it, guiding content optimization.
Intricate segmentation leads to a profound alignment of marketing strategies with audience needs, optimizing the experience for each user and maximizing conversion potential. The end goal is a dashboard that not only informs but also facilitates a proactive approach to audience engagement.
Utilize the Behavior Flow Report to Track User Paths
The Behavior Flow Report in Google Analytics stands out as a potent tool for mapping user navigation through a website. It enlightens companies on how visitors traverse from one page to the next, shedding light on the most engaging content and pinpointing potential drop-off points.
LinkGraph’s precise application of the Behavior Flow Report empowers organizations to understand not just where their audience goes, but why certain paths are favored, facilitating the refinement of the user’s journey to enhance site interaction and conversion rates.
Evaluate Content Performance to Improve Engagement
Assessing content performance is a critical component for LinkGraph’s clients aiming to enhance user engagement through their Google Analytics SEO dashboard. This evaluation illuminates which articles, videos, or infographics capture attention, inviting businesses to replicate successful formulas and rethink underperforming content.
Content performance metrics such as pageviews, average session duration, and bounce rate serve as beacons for gauging visitor interest and content relevance:
| Content Type | Pageviews | Average Session Duration | Bounce Rate |
|---|---|---|---|
| Blog Posts | 15,000 | 3 min | 40% |
| Infographics | 10,000 | 2 min | 60% |
| Videos | 8,000 | 4 min | 30% |
Engagement metrics offer direct insight into user behavior, permitting LinkGraph to guide clients in refining their SEO strategies and content to closely align with audience preferences and behaviors, ultimately driving higher conversion rates.
Leveraging Acquisition Reports for Channel Insights

Within the multi-faceted realm of Google Analytics, Acquisition Reports stand as a beacon for businesses aiming to hone their strategic outreach.
These reports offer a wealth of knowledge about the origins of website traffic, dissecting the channels through which audiences discover a website and engage with its content.
Mastery of Acquisition Reports enables companies to pinpoint which marketing channels fuel growth and necessitate further investment.
By tapping into acquisition data, organizations refine their marketing strategies, ensuring resources are allocated efficiently to maximize visibility and growth.
LinkGraph’s SEO services employ the detailed insights gleaned from these reports, guiding clients to cultivate marketing strategies that are data-informed and results-driven.
Assess Traffic Sources Using the Acquisition Reports
Delving into Acquisition Reports within Google Analytics affords businesses a detailed perspective on the efficacy of each marketing channel. LinkGraph’s SEO services excel in interpreting these reports, isolating valuable data that indicates which traffic sources are propelling website visits and informing decisions on where to concentrate future efforts.
Through meticulous analysis, the Search Atlas SEO tool empowers LinkGraph’s team to draw nuanced connections between various traffic sources – organic, direct, referral, social, or paid – and their contributions to overall website traffic and user engagement. This empowers clients to judiciously invest in channels yielding the highest ROI, solidifying their market position.
Understand the Impact of Different Channels on Growth
Discerning the differential impact of various traffic sources, be it search engines, social networks, or email campaigns, is vital for organizations scaling their online presence. LinkGraph’s SEO services are instrumental in deconstructing this data, revealing how each channel contributes to audience growth and business objectives, ensuring that investments are strategically aligned with performance indicators.
Insights drawn from the Search Atlas SEO tool enable businesses to adapt and refine their strategies, recognizing the multifarious ways distinctive channels catalyze website traffic and, in turn, foster lead generation and sales. It is these precise understandings that serve as the compass guiding companies to prudent resource allocation and robust growth trajectories.
Optimize Your Marketing Strategy With Acquisition Data
Through the astute application of acquisition data provided by Google Analytics, LinkGraph’s SEO services underpin the strategic enhancement of marketing approaches. This vital stream of information allows for a honed focus, guiding businesses to concentrate their efforts on high-performing channels to optimize ROI and augment digital traction.
Employing the Search Atlas SEO tool’s deep analytical capabilities enables a company’s marketing team to assess acquisition effectiveness swiftly and with precision. It ensures that the strategies implemented are grounded in data, fostering a marketing plan that is resilient, accurate, and aligned with the ever-changing behavior of their target audience.
Exploring Real-Time Reporting for Immediate Insights

In an age where instantaneity is paramount, the utilization of Real-Time Reporting in Google Analytics emerges as a pivotal instrument for businesses eager to monitor their digital ecosystem with agility.
Embracing the power of live data, professionals can keep a pulse on active users, measure the immediate impact of marketing initiatives, and recalibrate tactics with a newfound nimbleness.
This swift compilation of actionable insights accelerates strategic decision-making processes, enabling firms to respond adeptly to the dynamic digital landscape.
Monitor Active Users With Real-Time Reports
Real-Time reports within Google Analytics serve as a monitoring beacon, offering businesses a window into the activity levels of users the moment they interact with a website. This instantaneous tracking capability provided by LinkGraph’s SEO services, via the Search Atlas SEO tool, allows companies to discern the live impact of their marketing strategies and user engagement.
With these insights, organizations wield the ability to detect Real-Time User Trends, from surge in traffic due to a recent campaign to geographic hotspots of visitor activity. Employing Real-Time reports, LinkGraph aids its clients in identifying and seizing opportunities as they unfold, ensuring timely and informed business decisions that are responsive to live audience behavior.
Analyze the Immediate Effect of Campaigns and Updates
Real-Time Reporting in Google Analytics provides businesses with the valuable capability to gauge the instant impact of newly launched campaigns and website updates. At its core, this feature allows marketing teams to monitor metrics like traffic spikes, conversion rate changes, and bounce rates at the very moment new content or promotions go live.
This immediacy in data analysis derives from its real-time nature, offering a granular look into how current visitors interact with fresh elements introduced to a website. LinkGraph harnesses the power of rapid data through the Search Atlas SEO tool to advise on swift tactical shifts, ensuring that marketing strategies remain fluid and effective:
| Campaign | Website Visitors | Conversion Rate | Bounce Rate |
|---|---|---|---|
| New Product Launch | 2,500 | 5.8% | 30% |
| Seasonal Promotion | 3,000 | 4.2% | 40% |
| Content Update | 1,800 | 6.1% | 28% |
Adjust Tactics Swiftly Using Real-Time Data
Real-time data empowers businesses to act with precision and speed, transforming the way marketing campaigns are monitored and managed. LinkGraph’s SEO services excel at utilizing the immediacy of Google Analytics Real-Time Reports, allowing firms to adapt their marketing tactics dynamically as user engagement unfolds.
Through the capability of instant data analysis provided by the Search Atlas SEO tool, LinkGraph facilitates an agile marketing environment where strategies can be adjusted on-the-fly. This ensures that campaigns are constantly optimized, delivering content that resonates and drives conversions at the moment it matters most.
Utilizing Custom Reports and Dashboards for Deeper Analysis

In the digital marketing landscape, the ability to distill and customize data reporting is indispensable for steering strategic decisions.
The integration of Custom Reports and Dashboards within Google Analytics endows professionals with the acuity to surface their desired insights with razor-sharp precision.
By crafting tailored reports, stakeholders are afforded a crystal-clear view of their performance metrics, and with the collaborative power to share and export these dashboards, collective analysis and decision-making become both seamless and robust.
Employing Custom Dashboards specifically tuned to track Key Performance Indicators (KPIs) equips marketers to orchestrate their analytics in harmony with organizational goals, fostering an environment of focused tracking and strategic efficiency.
Create Custom Reports for Specific Insights
Embracing the capacity to generate Custom Reports is a strategic move that permits businesses to slice through voluminous data, isolating the exact metrics they require for informed decision-making. Such reports act as a compass, directing LinkGraph’s clients through the thickets of data to the clearings of valuable insights specific to their organizational needs.
With the tactful use of Custom Reports, LinkGraph’s bespoke analytics services lend themselves to a focused approach where critical indicators are brought to the forefront. This sharp customization ensures that every dashboard presents a distilled view of performance metrics, illuminating the path toward data-driven strategic refinement.
Share and Export Custom Dashboards for Collaborative Analysis
The versatility of Google Analytics extends beyond mere data analysis; it fosters team synergy through the sharing and exporting of Custom Dashboards. LinkGraph’s SEO services capitalize on this collaborative feature, enabling marketing teams to simultaneously access, review, and discuss analytics dashboards, ensuring all stakeholders are aligned and informed.
Exporting Custom Dashboards translates to the synthesis of analytics reports into actionable formats, aiding the collective patterning of strategies across various arms of an organization. The ability of LinkGraph’s clients to share nuanced insights solidifies an integrative approach to decision-making, anchoring a united front in data-driven marketing methodologies.
Use Custom Dashboards to Track Your KPIs Efficiently
Custom Dashboards in Google Analytics represent a compelling resolution for organizations seeking efficiency in monitoring essential Key Performance Indicators (KPIs). They serve as a central hub from which relevant data sets can be viewed and analyzed with ease, providing a streamlined approach so that teams can keep their fingers on the pulse of the organization’s health without the clutter of irrelevant data.
The efficacy of Custom Dashboards emanates from their ability to encapsulate and reflect an organization’s unique objectives as quantifiable data points:
- They enable swift access to pertinent analytics that directly inform strategy and business outcomes.
- Such dashboards allow for a focused snapshot of performance, facilitating timely decision-making and ongoing strategy refinement.
- In the grander scheme of operations, they empower teams to stay agile, pivoting with the data as it signals shifts in market conditions or consumer behavior.
Conclusion
Utilizing the Google Analytics dashboard effectively is crucial for businesses to gain deep insights into their website’s performance and user behavior.
By customizing the dashboard to focus on key metrics, segmenting the audience, and leveraging tools such as real-time reporting and behavior flow reports, companies can draw actionable conclusions that enhance their digital strategies.
LinkGraph’s SEO services, supported by the Search Atlas SEO tool, exemplify how to expertly navigate and interpret this vast array of data.
Setting up conversion tracking goals enables a clear view of customer journeys and the success of marketing initiatives.
Meanwhile, acquisition reports provide a breakdown of the most effective channels contributing to growth, allowing for optimized allocation of marketing resources.
Ultimately, mastering the Google Analytics dashboard allows for a fine-tuned, data-informed digital marketing approach that is responsive to real-time changes and tailored to achieve business objectives efficiently.